All about my research
1. Satellite galaxy evolution and connection to observations
Tools used: Cosmological simulation TNG50, Errani+21 and Errani+22 empirical tidal evolution models, AEGIS analytical model
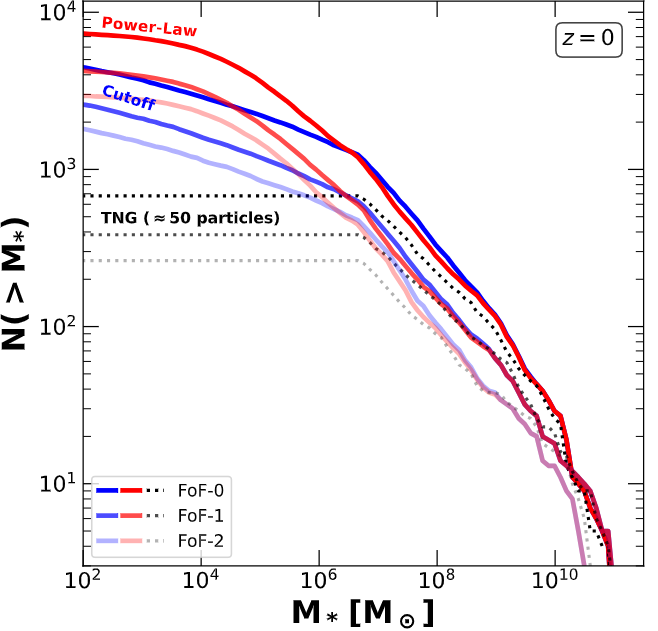
- Methodology: We combined the TNG50 cosmological hydrodynamical simulation with an empirical tidal evolution model to overcome the numerical resolution limits that typically cause the artificial disruption of dwarf galaxies in standard simulations.
- Predicted Abundance: By applying this model to the three most massive clusters in TNG50, the study predicts that clusters with a virial mass of $\sim 10^{14}M_{\odot}$ harbor a vast population of faint and ultra-faint dwarf galaxies, estimating between 2,000 and 7,000 systems with stellar masses $M_{*} > 100 M_{\odot}$ at $z=0$.
- Radial Distribution: While these satellites generally trace the underlying dark matter profile of the host cluster, applying observational detection thresholds tends to exclude the most heavily stripped objects located in the inner regions, making the observed radial distribution shallower in the inner regions compared to the dark matter disrtibution.
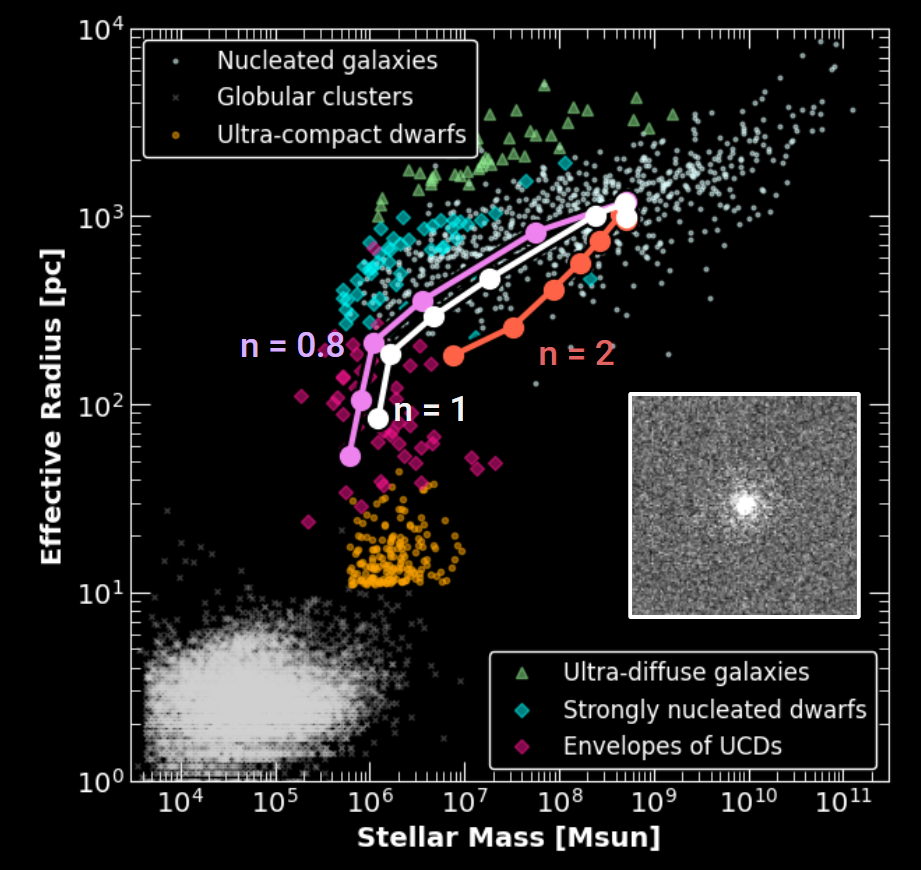
Envelope UCDs as the observed tidal remnants of nucleated dwarf galaxies
- Addressing UCD Formation: We employed the AEGIS analytical framework (built by Dr. Jens Stücker) to bypass computational bottlenecks associated with multiple length scales involved in tidal evolution of a nucleated dwarf galaxy. Having modeled the tidal stripping of nucleated dwarf galaxies, we investigated their evolutionary link to ultra-compact dwarfs (UCDs) and the faint envelopes recently detected around them.
- Advanced Mock Imaging: We modeled progenitors with a cuspy NFW dark matter profile and varying stellar envelopes (Sérsic index $n=0.8, 1$, and $2$), transformed the intrinsic physical data into mock images with realistic NGVS-like point spread function and noise.
- Observational Bias Explains eUCD Sequence: We discovered that while intrinsic model envelopes stay roughly $\gtrsim 100$ pc, applying standard observational fitting techniques (GALFIT) to the mock images successfully reproduces the observed 30–200 pc size–mass sequence of envelope UCDs (eUCDs), acting as an observational tidal track.
2. Bar formation in dwarf galaxies
Tools used: SMUGGLE and AREPO codes for running simulations
Bar formation within dwarf galaxies in CDM and SIDM using SMUGGLE
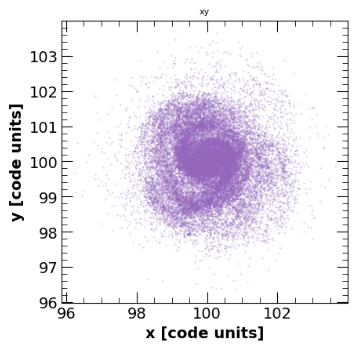
- We are running idealized hydrodynamic simulations within both CDM and SIDM paradigms using SMUGGLE to understand the formation of bars within dwarf galaxies with stellar mass $\sim 10^{7} M_{\odot}$.
- Stay tuned for more results!
3. Scaling relations used in galaxy groups and clusters
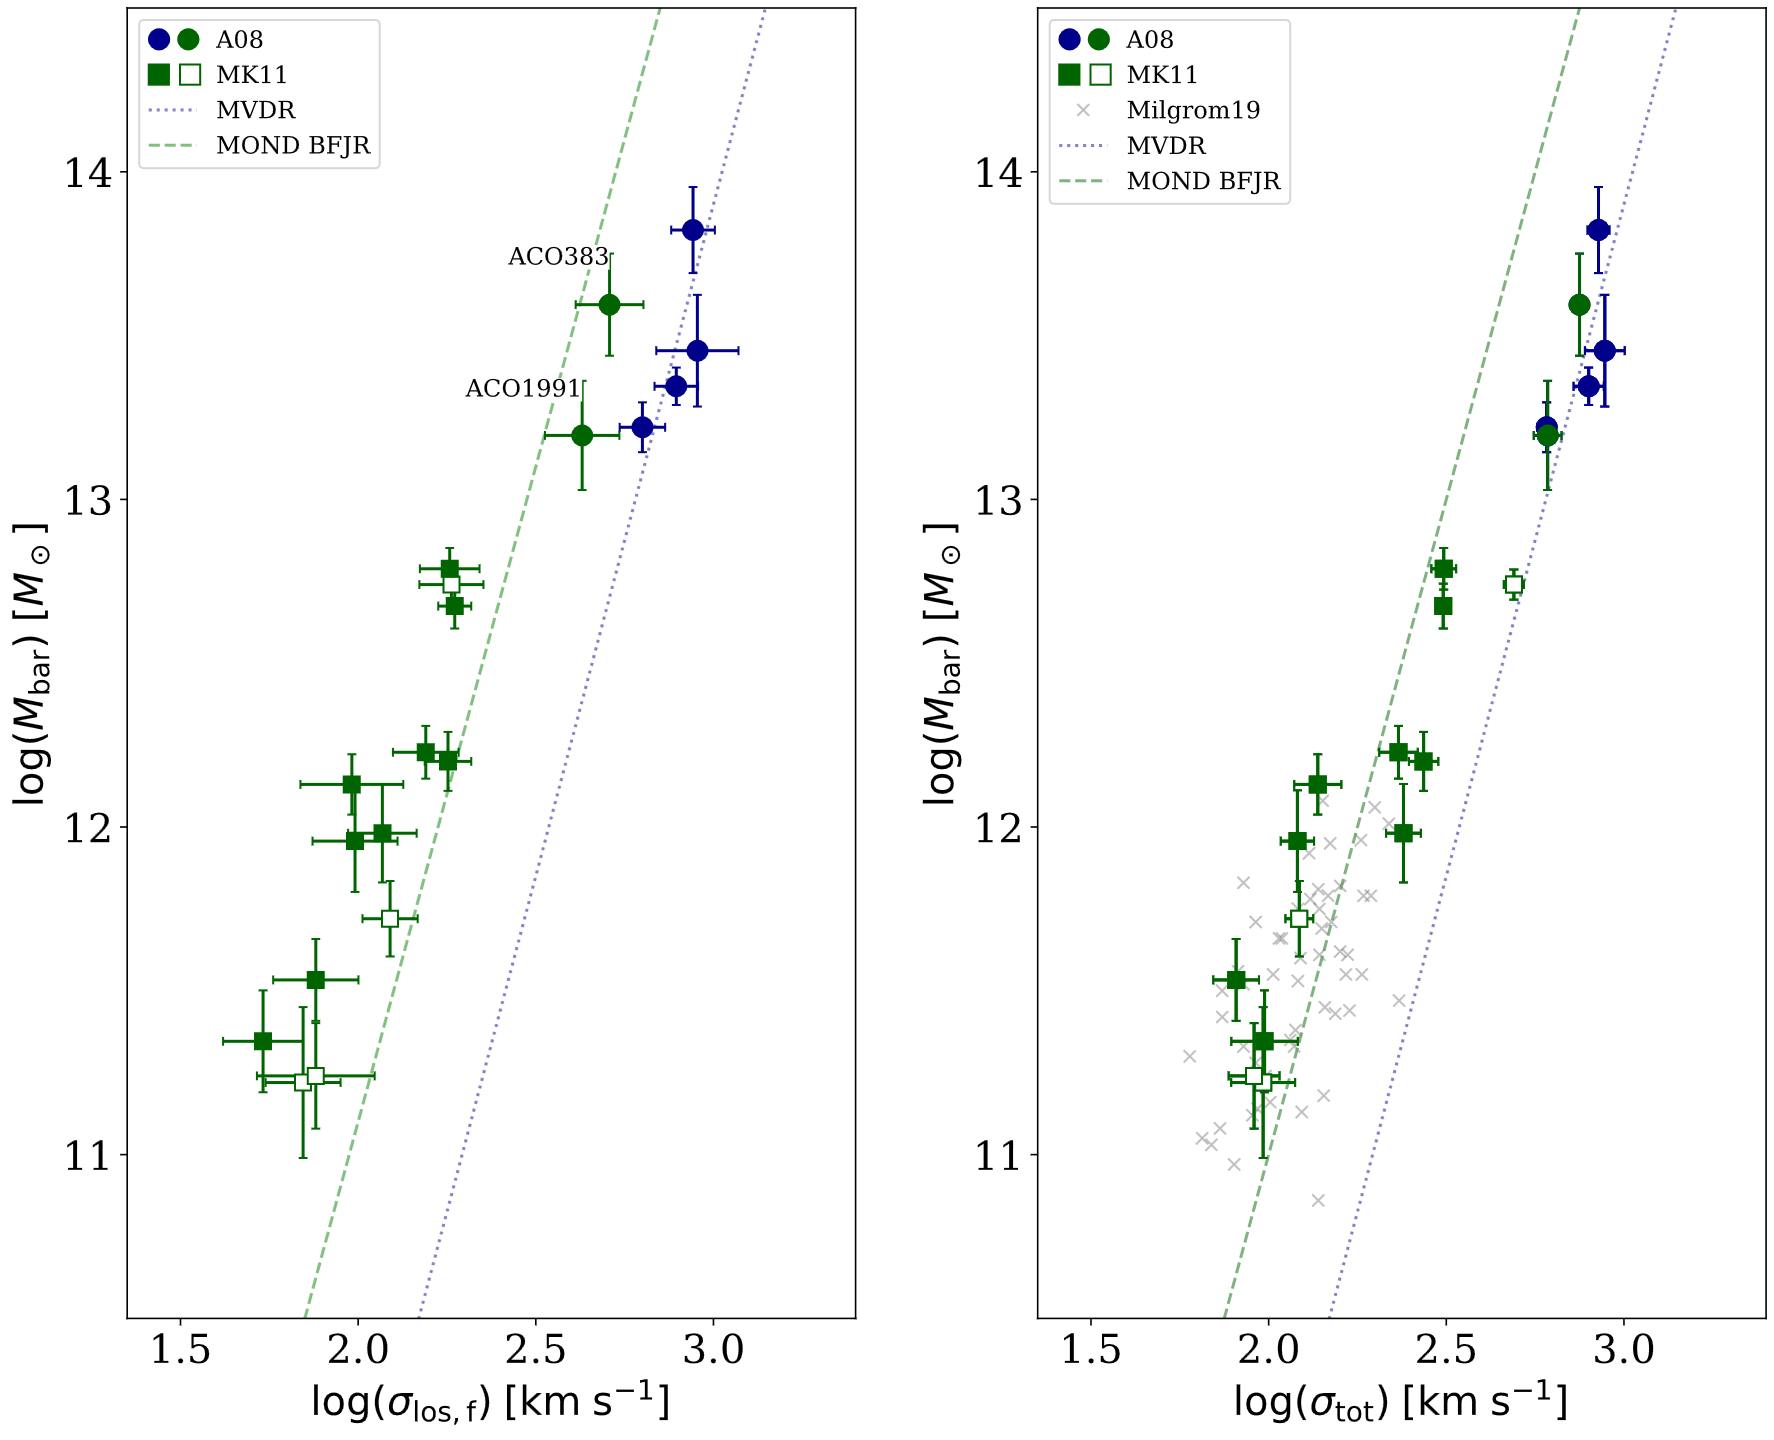
- Methodology and Scope: We investigated the baryonic Faber-Jackson relation (BFJR) by combining optical and X-ray measurements across 13 galaxy groups and 6 galaxy clusters. BFJR is the correlation between baryonic mass and velocity dispersion.
- Key Divergence in Acceleration Scales: We found that while the BFJR in galaxy groups aligns with standard Modified Newtonian Dynamics (MOND) predictions when using total velocity dispersion, galaxy clusters display a parallel BFJR characterized by a distinct, larger acceleration scale.
- Velocity Dispersion Profiles and Dark Matter Fractions: An initial analysis of stacked velocity dispersion profiles revealed both flat and declining types. The declining profiles suggest potential dearth of dark matter, which is further highlighted by the identification of three specific galaxy groups exhibiting unusually low DM fractions assuming isotropy.
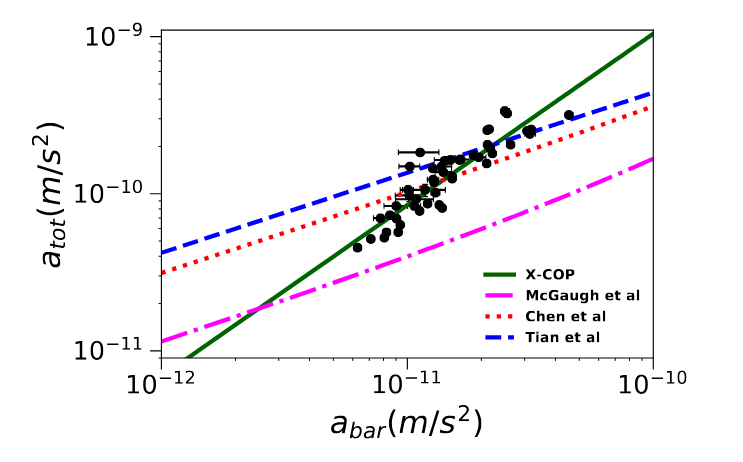
- Testing Cluster RAR Compliance: We evaluated the Radial Acceleration Relation (RAR) across two galaxy cluster samples: (i) a 12-cluster Chandra sample and (ii) a 12-cluster X-COP sample. We found that at least one (X-COP) obeys the relation with a small residual scatter of $0.11\text{ - }0.14\text{ dex}$.
- Lack of Universality: Despite the tight correlation observed within individual datasets, the best-fit parameters across different cluster samples disagree with each other and with prior literature, indicating that the RAR is not universal across all different mass scales.
- Higher Acceleration Scale: For both analyzed catalogs, the derived acceleration scale ($a_0$) is roughly an order of magnitude larger than the value typically obtained for individual spiral galaxies ($a_0 \sim 1.2 \times 10^{-10} \text{ m/s}^2$).